Atlantic Croaker
Latest News and Resources
-
Atlantic Croaker Stock Assessment Workshop Scheduled for March 2-6, 2026 in Arlington, VA
-
Sciaenids Management Board Annual Meeting Presentations — October 2025
-
Sciaenids Plan Review Teams Meeting Agenda — November 2025
-
Sciaenids Management Board Annual Meeting Supplemental Materials — October 2025
-
Sciaenids Management Board Annual Meeting Materials — October 2025
-
Atlantic Croaker Species Management Overview
-

Population Abundance
Unknown

Fishing Mortality
Unknown
Current Status
Management action based on trend analysis for the Mid-Atlantic and South Atlantic. Changes to recreational and commercial fishery regulations implemented in 2020. Benchmark assessment underway.
Meeting Calendar
Next Meeting
-
Mar 2–6, 2026
Atlantic Croaker Stock Assessment Workshop
In-person, ASMFC Offices, 1050 N. Highland Street, Suite 200 A-N, Arlington, VBA 22201
Contacts
- Tracey Bauer, FMP Coordinator (TBauer@asmfc.org)
- Management Board, Doug Haymans, Chair
- Technical Committee, Margaret Finch, Chair
- Advisory Panel, Craig Freeman, Chair
Species Information
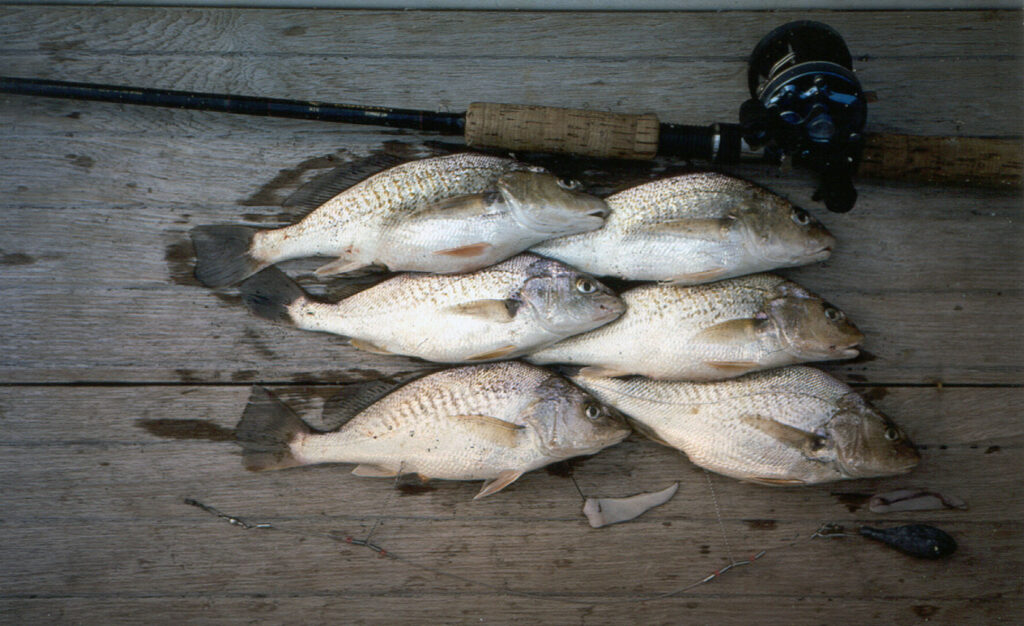
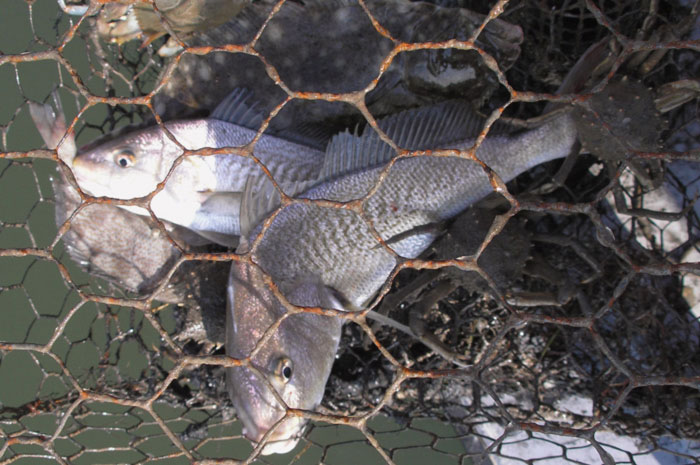
Atlantic croaker, named for the croaking sounds they make during spawning, are a popular species for recreational and commercial fisheries along the Atlantic coast. Despite declining landings in recent years, they remain an important part of the ecosystem and fishing communities, particularly from the Chesapeake Bay to Florida. Through adaptive management strategies like the Traffic Light Analysis, the Commission works to monitor trends, address challenges, and maintain the health of Atlantic croaker populations.
Management
Atlantic croaker are managed under Amendment 1 to the Interstate Fishery Management Plan for Atlantic Croaker (2005) and Addenda I, II, and III (2011, 2014, 2020). The Amendment did not require any specific measures restricting harvest but encouraged states with conservative measures to maintain them. It also implemented a set of management triggers, based on an annual review of certain metrics, to respond to changes in the fishery or resource and initiate a formal stock assessment on an accelerated timeline if necessary. Addendum I revises the management program’s biological reference points to assess stock condition on a coastwide basis as recommended by the 2010 stock assessment.
Addendum II to Amendment I to the Atlantic Croaker Fishery Management Plan (FMP) established a TLA to evaluate fisheries trends and develop state-specified management actions (i.e., bag limits, size restrictions, time & area closures, and gear restrictions) when harvest and abundance thresholds are exceeded. The TLA is a statistically-robust way to incorporate multiple data sources (both fishery-independent and -dependent) into a single, easily understood metric for management advice. It is often used for data-poor species, or species which are not assessed on a frequent basis, such as blue crabs in North Carolina and snow crabs in the Gulf of St. Lawrence.
Addendum III to Amendment I to the FMP adjusted the TLA to incorporate additional fishery-independent indices, age information, use of regional characteristics, and changes to the management triggering mechanisms. Management triggers and responses include bag limits for the recreational fishery and percentage harvest reductions from a 10 year average for the commercial fishery. The response will be defined by which percent threshold (30% or 60%) that was exceeded in any of the 3 out of 4 terminal years.
Additionally, in March 2017, a report on Sciaenid Fish Habitat was released including information on habitat for several species, including Atlantic croaker during all stages of their lives; their associated Essential Fish Habitats and Habitat Areas of Particular Concern; threats and uncertainties to their habitats; and recommendations for habitat management and research. This report is meant to be a resource when amending future species FMPs.
Stock Status
In 2017, a benchmark stock assessment was completed. This assessment used a stock synthesis model to address a major source of uncertainty from previous assessments – the magnitude of croaker bycatch in South Atlantic shrimp trawls. However, due to conflicting trends in abundance and harvest, as well as other uncertainties, this assessment was not recommended for management use.
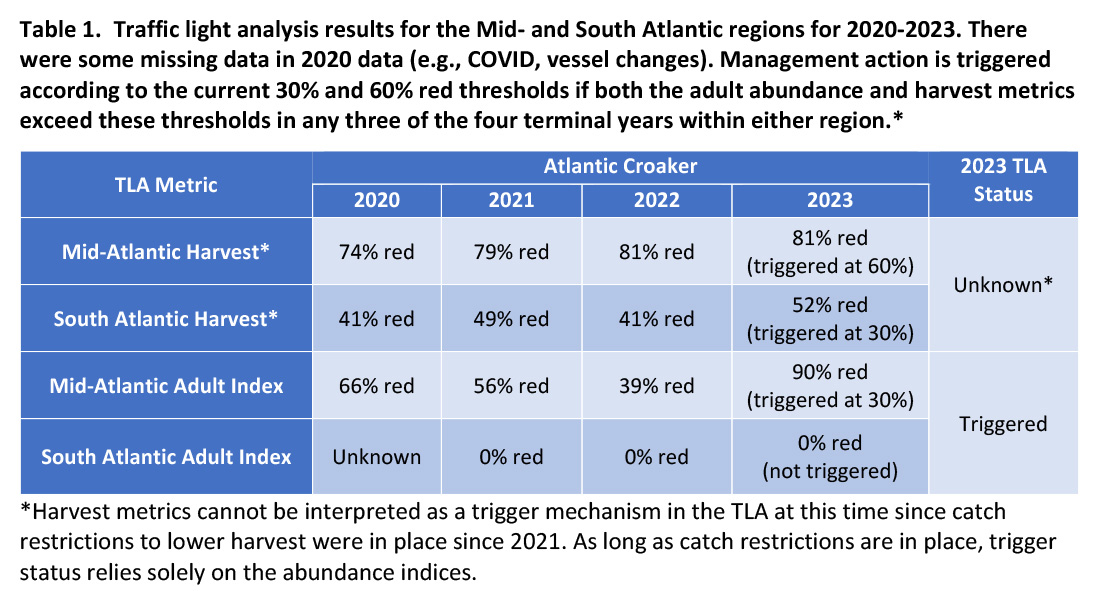
A traffic light analysis (TLA) is typically conducted each year to evaluate fishery trends and develop state-specific management actions (e.g. bag limits, size restrictions, time and area closures, and gear restrictions) when harvest and abundance thresholds are exceeded for three consecutive years. The name comes from assigning a color (red, yellow or green) to categorize relative levels of indicators that reflect the condition of the fish population (abundance metric) or fishery (harvest metric). For example, as harvest increases relative to the long-term mean, the proportion of green in a given year increases, and as harvest decreases, the amount of red in that year becomes more predominant. The TLA improves the management approach as it illustrates long-term trends in the stock and includes specific management recommendations in response to declines in the stock or fishery.
Similar to the benchmark assessment, recent TLA runs showed conflicting trends, with significant decreases in overall harvest but increases in adult abundance and some juvenile abundance. Based on these conflicting trends (theoretically, an increase in abundance should lead to an increase in harvest), the Technical Committee evaluated the TLA and recommended several adjustments, including incorporation of additional abundance surveys, application of age-length keys and length compositions to all abundance surveys to better estimate the number of adults, use of regional rather than coastwide metrics, a new reference time period, and a new triggering mechanism. These adjustments were made in Addendum III, which the Board approved in February 2020.
In October 2020, the TLA was presented to the Board using both the current and Technical Committee-recommended methods. The TLA showed similar results of declining adult abundance with declining harvest and triggered management action. The results of the Technical Committee recommended method, which included all proposed changes, triggered management action due to significant declines in harvest and adult abundance in the Mid-Atlantic (north of Virginia-North Carolina border) region. States that are considered non de minimis were required to begin immediate management action as outlined in Addendum III. This includes a recreational bag limit of 50 fish per person per day and a reduction in commercial harvest of 1% from the states 10-year average. Addendum III states these management measures must be in place for at least three years, before being reevaluated based on adult abundance metrics. State implementation plans for management measures were approved in early 2021 and all new management measures were enacted by the end of 2021.
The TLAs for both species were updated with data through 2024, and presented to the Board in August 2025. For Atlantic croaker, the adult abundance metric exceeded the 30% threshold in all four terminal years in the South Atlantic and the 60% threshold in all four terminal years in the Mid-Atlantic. Addendum III states, in this case, the TC must evaluate trends in the stock’s abundance to recommend to the Board whether triggered measures should remain in place or more restrictive measures should be considered. The Board agreed with the TC’s recommendation to maintain current management measures, due to the anticipation of results from the ongoing benchmark stock assessment within the next year.
Commercial & Recreational Fisheries
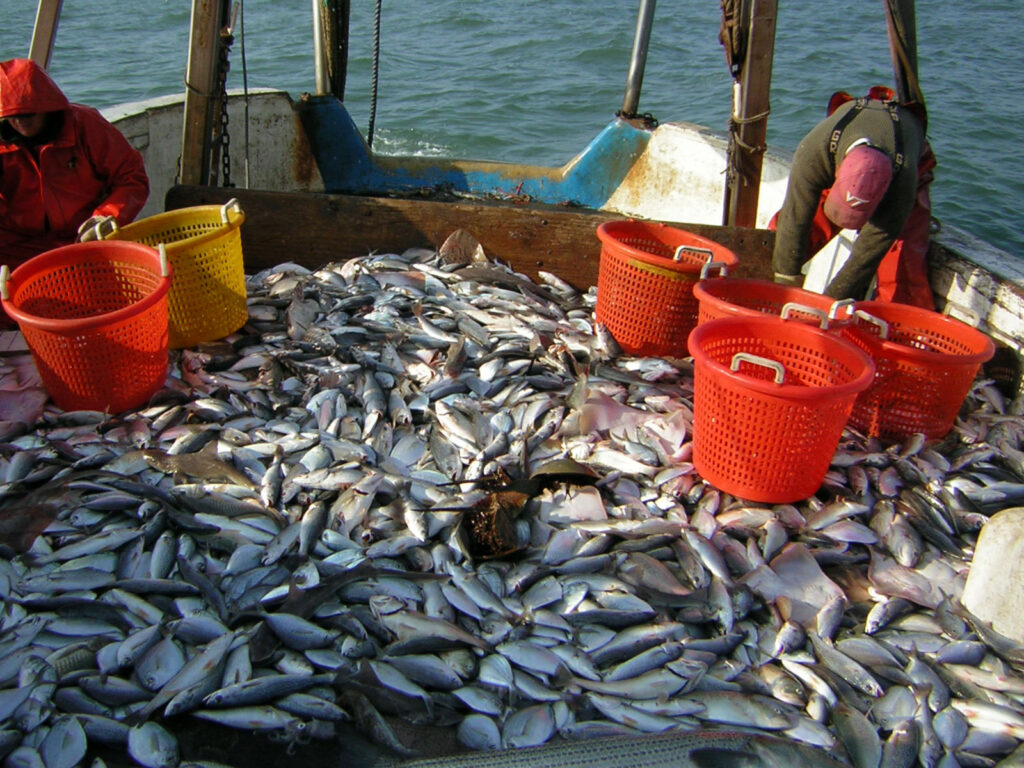
Sought by recreational anglers and commercial fishermen alike, an estimated 2.4 million pounds of croaker were landed in 2024. The commercial and recreational fisheries harvested 34% and 66% of the 2024 total, respectively, which continues a trend that began in 2020, of the recreational fishery harvesting a majority (2020-2024 average=74%) of the total Atlantic croaker harvest. This represents a large shift from the historical spilt of recreational and commercial Atlantic croaker harvest, averaging 43% and 57%, respectively. Virginia harvested the majority of croaker recreationally while North Carolina harvested the majority of commercial landings.
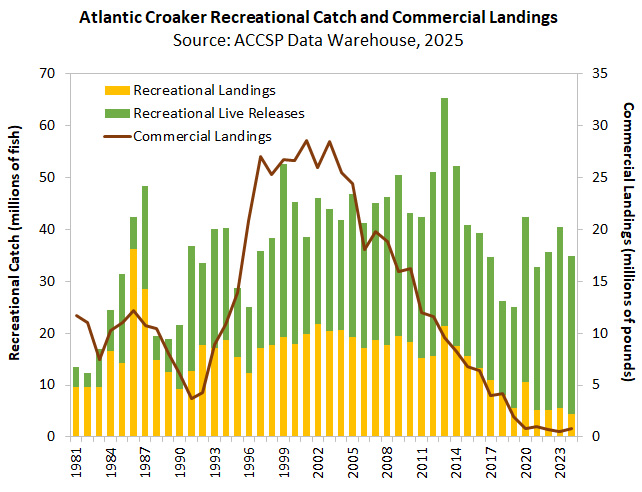
Atlantic coast commercial landings of Atlantic croaker exhibit a cyclical pattern, with low landings in the 1960s to early 1970s and the 1980s to early 1990s, and high landings in the mid-to-late 1970s and the mid-1990s to 2011. Commercial landings increased from a low of 3.7 million pounds in 1991 to 28.6 million pounds in 2001; however, landings have had a declining trend since then, from 47 million pounds in 2003 to 505,828 pounds in 2023, the lowest value of the time series (1950-2024). Commercial landings increased by 65% in 2024, to 835,315 pounds. From 1981-2024, recreational landings from New Jersey through Florida have varied between 4.4 million fish in 2024 and 36.2 million fish in 1986. Recreational landings generally increased until 2001, and held stable from 2001-2006 before exhibiting a declining trend from 2007 through 2024. Recreational landings in 2024 in both numbers of fish and weight were both time series lows. The number of recreational releases generally increased over the time series until 2013 when releases steadily declined until 2018, when a time series low of 18.1 million fish were released. From 2018 through 2024, releases have overall been increasing again. In 2024, anglers released 30.4 million fish, a 12% decrease from the 34.8 million fish released in 2023. Anglers also released a greater percentage of the total recreational catch in 2024, compared to 2023. An estimated 87.3% of the total recreational croaker catch was released in 2024, the highest percentage on record for a fourth year in a row.
Life History
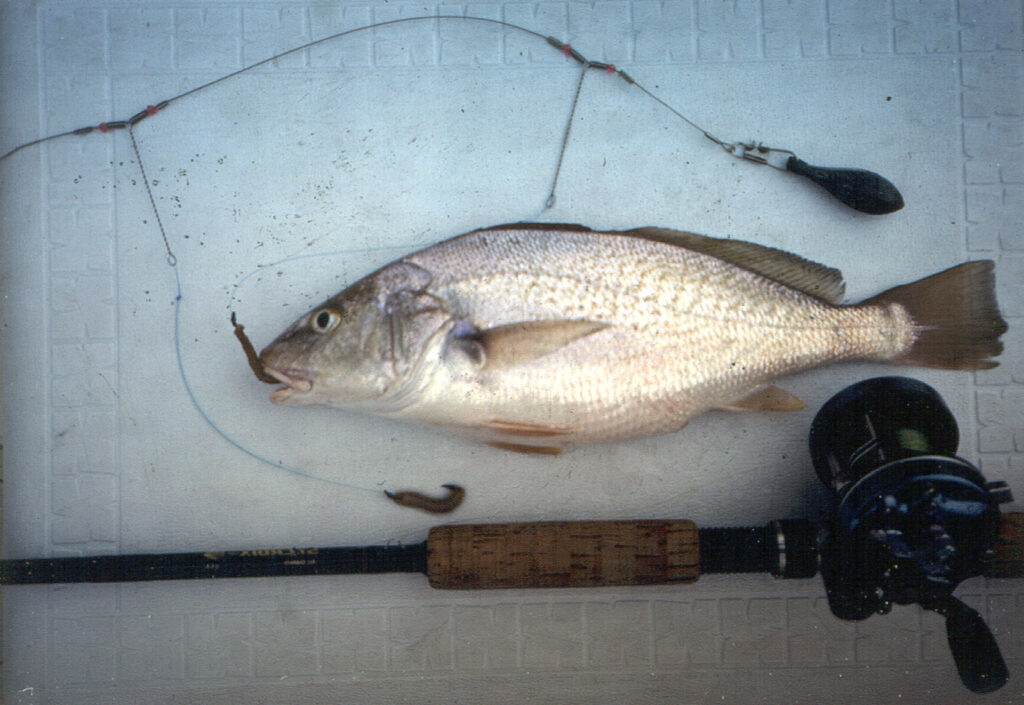
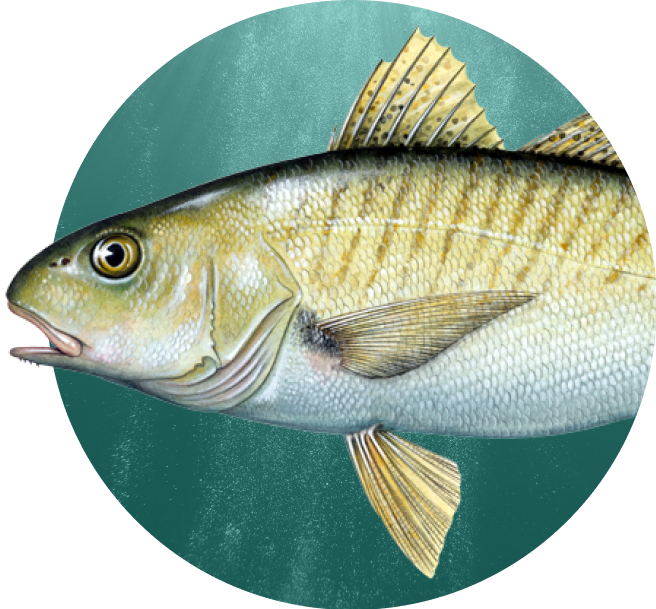
Atlantic croaker (Micropogonias undulates) are a bottom-dwelling species, in the same family as red drum and weakfish. They can be found from the Gulf of Maine to Argentina, but along the US Atlantic coast, they are most abundant from the Chesapeake Bay to northern Florida. Their name is derived from croaking noises they make during the spawning season by vibrating their abdominal muscles against their swim bladder.
Atlantic croaker spawn in warm pelagic waters during the fall and winter months, and the larvae and juveniles settle in estuaries to mature. The Chesapeake Bay is an important spawning and nursery habitat for croaker.
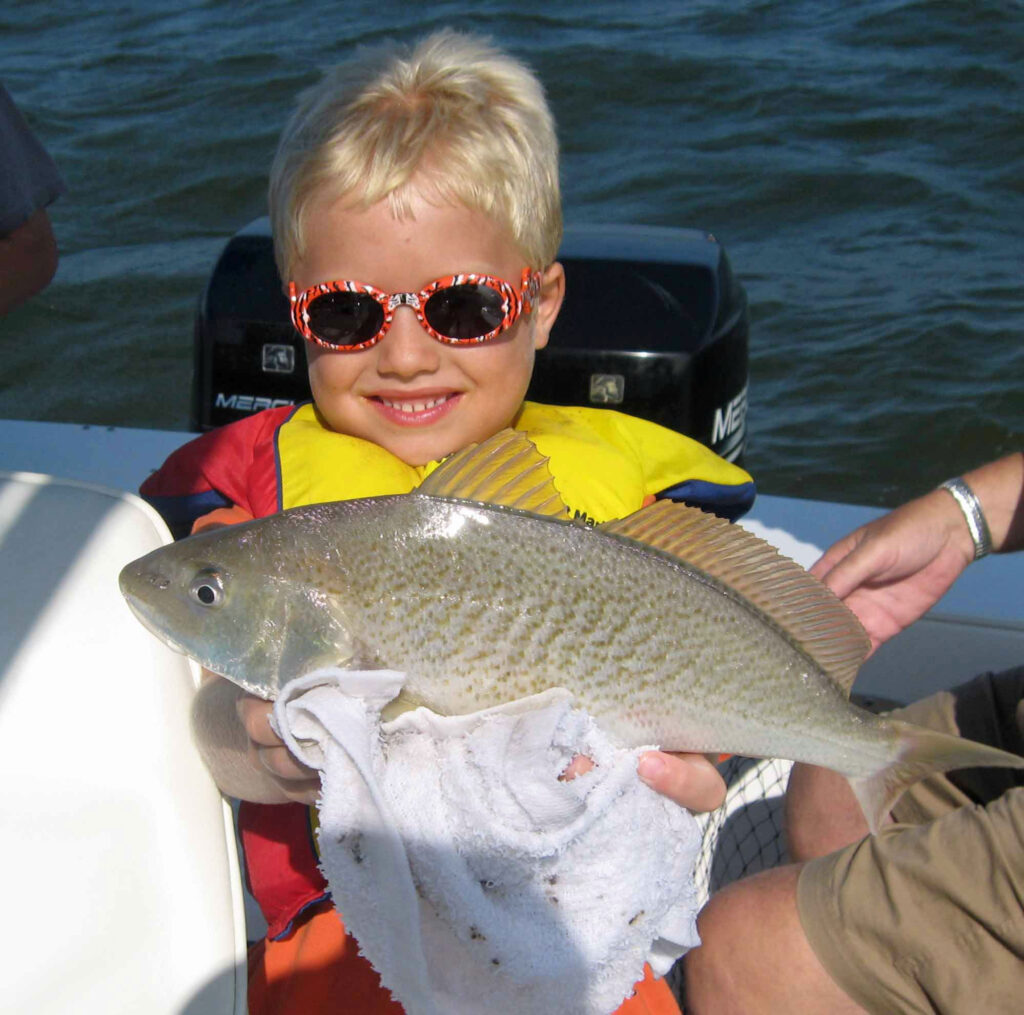
Most Atlantic croaker are mature by the end of their first year. They grow quickly and may reach sizes of over 20”. The world record for Atlantic croaker is 8 lbs 11 oz. The oldest observed age is 17 years, but it is uncommon to see fish older than 10 years in the catch.
News & Resources
Explore recent news, management updates, and scientific reports to gain a deeper understanding of ongoing conservation efforts and sustainability strategies.
-
Arlington, VA – The Atlantic States Marine Fisheries Commission will hold the Atlantic Croaker Benchmark Stock Assessment Workshop at the Commission’s office, 1050 N. Highland Street, Suite 200 A-N, Arlington, VA. The stock assessment will evaluate the health of Atlantic croaker stocks and inform management of this species. The Commission’s stock assessment process and meetings…
-
-
-
South Atlantic Advisory Panel Meeting Summary from October 2025
-
Consider Red Drum Addendum II: Modifications to Red Drum Management for Final Approval, Review Options, Public Comment Summary, and Advisory Panel Report (T. Bauer), Consider Final Approval of Addendum II; Consider Approval of Black Drum and Spotted Seatrout Fishery Management Plan Reviews and State Compliance for the 2024 Fishing Year (T. Bauer); Progress Update on…
-
Prepared for the Commissioner Manual
-
The purpose of this report is to evaluate the current status of Atlantic croaker using the annual Traffic Light Analysis (TLA). Annually, the Technical Committee (TC) conducts a TLA to evaluate a Mid-Atlantic and a South Atlantic harvest metric, combining commercial and recreational landings in the region.
-
-
-
A summary of all the board meetings, press releases and motions from the 2025 Summer Meeting.
-
The Sciaenids Management Board of the Atlantic States Marine Fisheries Commission convened in the Jefferson Ballroom of the Westin Crystal City Hotel, Arlington, Virginia, via hybrid meeting, in-person and webinar; Tuesday, August 5, 2025, and was called to order at 2:30 p.m. by Chair Doug Haymans.
-
Consider Red Drum Draft Addendum II on Modifications to Red Drum Management for Public Comment; Review 2025 Traffic Light Analyses for Spot and Atlantic Croaker; Consider Delaware Spot Commercial Measures Proposal; Consider Atlantic Croaker and Red Drum Fishery Management Plan Reviews and State Compliance for the 2024 Fishing Year
-
The Atlantic States Marine Fisheries Commission’s Summer Meeting will be August 5-7, 2025 at The Westin Crystal City.
-
Consider Red Drum Draft Addendum II on Modifications to Red Drum Management for Public Comment; Review 2025 Traffic Light Analyses for Spot and Atlantic Croaker; Consider Delaware Spot Commercial Measures Proposal; Consider Atlantic Croaker and Red Drum Fishery Management Plan Reviews and State Compliance for the 2024 Fishing Year
-
This memorandum serves as a summary of the joint Spot and Atlantic Croaker Technical Committees (TCs) call on July 8, 2025. The following summary outlines the TCs’ discussions and recommendations for the Board regarding the 2024 fishing year (FY) Traffic Light Analysis (TLA) for both species.
Get Hooked on ASMFC News
Dive into the latest updates and catch all the important news by joining our newsletter mailing list. Stay in the loop with meeting agendas, fisheries management news, and more.
